Andalusia Basic Data 1997
9. Industry
9.1. Establishments and employed persons by branch of activity
| Mining and quarrying | Manufacturing | Electricity, water and gas | ||||
| Establishments | Persons | Establishments | Persons | Establishments | Persons | |
| Almería | 6 | 42 | 1.757 | 9.556 | 80 | 946 |
| Cádiz | 12 | 132 | 2.618 | 36.716 | 86 | 1.984 |
| Córdoba | 15 | 71 | 3.275 | 22.920 | 114 | 1.115 |
| Granada | 16 | 444 | 3.021 | 19.078 | 66 | 1.034 |
| Huelva | 15 | 1.503 | 1.371 | 14.964 | 58 | 828 |
| Jaén | 9 | 238 | 2.882 | 26.050 | 70 | 489 |
| Málaga | 6 | 56 | 3.586 | 28.350 | 78 | 1.002 |
| Sevilla | 30 | 269 | 4.667 | 51.944 | 106 | 2.389 |
| Andalucía | 109 | 2.755 | 23.177 | 209.578 | 658 | 9.787 |
| España | 1.002 | 48.960 | 190.000 | 2.308.538 | 3.708 | 80.349 |
SOURCE: IEA. Censo de Locales de Andalucía 1990. INE. Censo de Locales 1990.
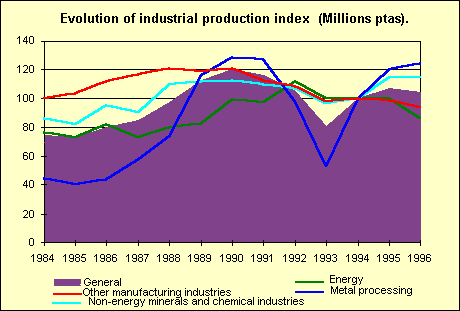
9.2. Index numbers of industrial production
| NCEA classification | Annual average | Rate 96/95 (%) |
| General | 104,0 | -2,5 |
| Energy | 86,4 | -13,6 |
| Non-energy minerals and chemical industry | 115,0 | 0,5 |
| Metal processing | 124,6 | 3,7 |
| Other manufacturing industries | 93,9 | -4,7 |
| By economic destination of goods | ||
| Consumer goods | 93,0 | -6,2 |
| Investment goods | 127,3 | 5,0 |
| Intermediate goods | 103,7 | -3,2 |
SOURCE: IEA. Data refer to 1996.

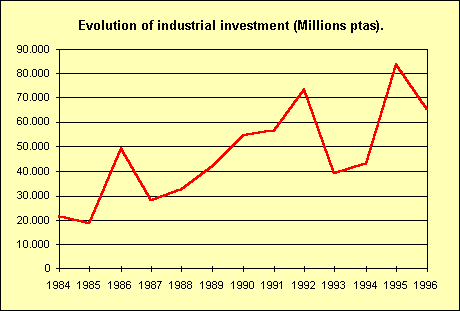
9.3. Investment and employment by branch of activity (thousands ptas)
| Minig and quarrying | Manufacturing | Energy, electricity, water and gas | ||||
| Investment | Employment | Investment | Employment | Investment | Employment | |
| Almería | 502.680 | 22 | 4.402.838 | 662 | - | 15 |
| Cádiz | 159.013 | 38 | 12.753.637 | 1.344 | 6.712.454 | 97 |
| Córdoba | 55.000 | 5 | 3.438.901 | 1.035 | 2.672.182 | 33 |
| Granada | 251.111 | 35 | 2.191.269 | 676 | 1.537.822 | 30 |
| Huelva | 648.909 | 7 | 4.245.616 | 326 | 948.499 | 17 |
| Jaén | - | - | 4.776.636 | 1.484 | 940.606 | 41 |
| Málaga | 90.489 | 8 | 4.236.594 | 993 | 253.182 | 18 |
| Sevilla | 43.197 | 11 | 13.633.510 | 4.240 | 481.484 | 34 |
| Andalucía | 1.750.399 | 126 | 49.679.001 | 10.760 | 13.546.229 | 285 |
SOURCE: Cª de Trabajo e Industria. Registro Industrial 1996.
