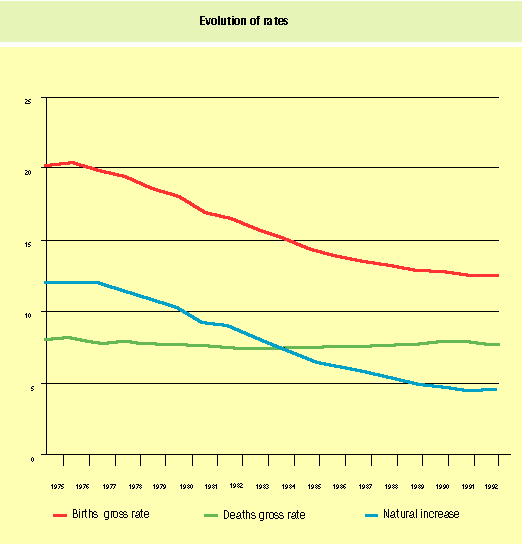
2. Population
2.1. Census figures by sex
| Total | Males | Females | Density (inhab/km2) | ||
| Almería | 493.126 | 245.056 | 248.070 | 56,20 | |
| Cádiz | 1.127.622 | 560.462 | 567.160 | 152,69 | |
| Córdoba | 782.221 | 383.046 | 399.175 | 57,02 | |
| Granada | 841.829 | 412.720 | 429.109 | 67,18 | |
| Huelva | 458.674 | 226.952 | 231.722 | 45,48 | |
| Jaén | 666.767 | 329.664 | 337.103 | 49,40 | |
| Málaga | 1.224.959 | 601.883 | 623.076 | 169,19 | |
| Sevilla | 1.719.446 | 844.550 | 874.896 | 122,81 | |
| Andalucía | 7.314.644 | 3.604.333 | 3.710.311 | 83,85 | |
| España | 40.460.055 | 19.846.523 | 20.613.532 | 80,16 | |
SOURCE: INE. Población de Derecho de los Municipios Españoles.
Rectificación del Padrón Municipal de Habitantes a 1 de Enero de 1995.
2.2. Census figures by sex and age group
| Total | Males | Females | |
| From 0 to 4 years | 451.201 | 231.881 | 219.320 |
| From 5 to9 years | 518.697 | 265.836 | 252.861 |
| From 10 to 14 years | 618.910 | 317.834 | 301.076 |
| From 15 to 19 years | 635.064 | 324.323 | 310.741 |
| From 20 to 24 years | 616.062 | 313.712 | 302.350 |
| From 25 to 29 years | 575.415 | 289.870 | 285.545 |
| From 30 to 34 years | 507.260 | 254.851 | 252.409 |
| From 35 to 39 years | 423.346 | 212.229 | 211.117 |
| From 40 to 44 years | 385.934 | 192.580 | 193.354 |
| From 45 to 49 years | 359.734 | 178.600 | 181.134 |
| From 50 to 54 years | 330.201 | 160.478 | 169.723 |
| From 55 to 59 years | 367.873 | 178.765 | 189.108 |
| From 60 to 64 years | 337.618 | 161.052 | 176.566 |
| From 65 to 69 years | 286.605 | 132.634 | 153.971 |
| From 70 to 74 years | 207.185 | 87.076 | 120.109 |
| From 75 to 79 years | 157.660 | 60.744 | 96.916 |
| From 80 to 84 years | 101.150 | 35.479 | 65.671 |
| > 85 years | 60.607 | 18.347 | 42.260 |
SOURCE: IEA. Censo de Población de Andalucía 1991.
2.3. Natural movement of the population. Rates per 1000 inhabitant
| Marriages | Births | Deaths | Natural increase | |
| Almería | 5,53 | 11,97 | 7,50 | 4,47 |
| Cádiz | 5,35 | 11,47 | 6,83 | 4,64 |
| Córdoba | 5,72 | 11,68 | 8,87 | 2,81 |
| Granada | 5,68 | 11,60 | 8,47 | 3,13 |
| Huelva | 4,94 | 11,93 | 8,48 | 3,45 |
| Jaén | 5,75 | 11,90 | 8,23 | 3,66 |
| Málaga | 4,93 | 10,42 | 8,02 | 2,40 |
| Sevilla | 5,45 | 11,61 | 7,78 | 3,82 |
| Andalucía | 5,40 | 11,46 | 7,94 | 3,52 |
Rates have been calculated using the average of projected population size, middle assumption data,
for 1994 and 1995.
SOURCE: INE. Movimiento Natural de la Población. Año 1994. Datos provisionales.
IEA. Proyecciones de la población de Andalucía 1991-2006.

2.4. Population´s mobility. Rates per 1000 inhabitant
| Inmigration | Emigration | Net Migration | Net Migration Rate | |||
| Total | Rate | Total | Rate | |||
| Almería | 11.449 | 23,56 | 10.328 | 21,25 | 1.121 | 2,31 |
| Cádiz | 14.040 | 12,56 | 15.138 | 13,54 | -1.098 | -0,98 |
| Córdoba | 8.840 | 11,34 | 9.316 | 11,95 | -476 | -0,61 |
| Granada | 16.473 | 19,76 | 16.241 | 19,48 | 232 | 0,28 |
| Huelva | 5.330 | 11,71 | 5.824 | 12,80 | -494 | -1,09 |
| Jaén | 8.867 | 13,36 | 9.818 | 14,80 | -951 | -1,43 |
| Málaga | 22.414 | 18,49 | 20.371 | 16,80 | 2.043 | 1,68 |
| Sevilla | 25.090 | 14,77 | 23.140 | 13,62 | 1.950 | 1,15 |
| Andalucía | 112.503 | 15,52 | 110.176 | 15,20 | 2.327 | 0,32 |
SOURCE: INE. Migraciones. Data refer to 1994
2.5. Population projections. 1996-2006
| 1996 | 1997 | 1998 | 1999 | 2000 | 2001 | 2002 | 2003 | 2004 | 2005 | 2006 | |
| Almería | 468.283 | 470.762 | 473.173 | 475.507 | 477.825 | 480.088 | 482.292 | 484.423 | 486.472 | 488.413 | 490.231 |
| Cádiz | 1.111.182 | 1.117.440 | 1.123.790 | 1.130.079 | 1.136.323 | 1.142.487 | 1.148.584 | 1.154.520 | 1.160.277 | 1.165.785 | 1.171.003 |
| Córdoba | 760.226 | 761.207 | 762.140 | 762.933 | 763.600 | 764.127 | 764.512 | 764.767 | 764.846 | 764.747 | 764.445 |
| Granada | 802.943 | 804.739 | 806.415 | 807.995 | 809.516 | 810.897 | 812.138 | 813.225 | 814.157 | 814.909 | 815.444 |
| Huelva | 449.392 | 450.677 | 452.033 | 453.459 | 454.983 | 456.628 | 458.269 | 459.906 | 461.534 | 463.111 | 464.641 |
| Jaén | 638.887 | 638.782 | 638.591 | 638.326 | 637.943 | 637.446 | 636.842 | 636.127 | 635.259 | 634.254 | 633.083 |
| Málaga | 1.233.070 | 1.246.613 | 1.260.079 | 1.273.495 | 1.286.880 | 1.300.242 | 1.313.542 | 1.326.750 | 1.339.806 | 1.352.690 | 1.365.323 |
| Sevilla | 1.678.311 | 1.689.927 | 1.701.647 | 1.713.507 | 1.725.338 | 1.737.138 | 1.748.830 | 1.760.362 | 1.771.619 | 1.782.533 | 1.793.003 |
| Andalucía | 7.142.294 | 7.180.147 | 7.217.868 | 7.255.301 | 7.292.408 | 7.329.053 | 7.365.009 | 7.400.080 | 7.433.970 | 7.466.442 | 7.497.173 |